One cold day in History… Russia
One cold day in January 1958, a copy of LIFE magazine was delivered to Shapiro’s Modern Economic store at 28 W. Blackwell Street, in Dover, New Jersey.

The shopkeepers, Israel and Ida (Fogelson) Shapiro were perhaps moved by the cover photo. It depicted a mounted Cossack soldier about to slash a poor peasant woman with his saber.
The issue was devoted to “a new and authoritative account” of the Russian revolution that ended the reign of Czar Nicholas II and the Romanov family dynasty. Irving and Ida, both Russian immigrants (from a region violently taken ripped from Poland), gave the magazine issue to their son Henry and his wife, Doris, who saved it. The Life magazine cover now hangs on a wall in our home as a reminder of my wife’s grandparents’ struggles and incredible resilience.
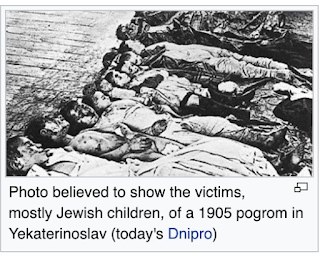
This cover photo captures the bitter personal history of the Shapiro’s, the Fogelson’s, the Raicer’s, and so many other Jewish families who made their way to Dover at the turn of the 20th Century. They fled the harsh Russian “pograms” that resulted in the deaths of thousands of Jews and the displacement of whole Jewish communities. Waves of Jewish families arrived here with nothing in their pockets and only the clothing they could carry. Israel restarted his life as a peddler carrying his wares in a sack on his back and walking from town to town. Yet, by the 1950s he and his fellow immigrants had become prominent business owners, shopkeepers, and community leaders. The unwanted “refuse” rejected by Russia blossomed here under our democratic and open society.
This brings us to us today, as Russian troops once again murder innocent civilians and lay siege to Ukraine. We have to ask why. Why are the good people of Russia so cursed with abysmal “strongman” governments? When will their voices ever be heard? When will the Russian people be free to navigate their own future?
Attacks on Facts Designed to Kill Democracy
by Brian T. Lynch, MSW
Is it a fact that dictionaries define words like “violence”, “assault”, or “vandalism” as “Legitimate Political Discourse?”
Of course not!
Yet that’s exactly what the Republican National Committee declared in a voice vote taken on February 4, 2022, to censure Representatives Liz Cheney and Adam Kinzinger for their participation in the investigation of the deadly January 6th attack on the U.S. Capitol. Political violence is violence perpetrated to achieve political goals. Whether or not such violence is legitimate is a separate judgment call on which two sides may not agree. The larger question is how did we come to the point where one of our major political parties thinks violence is a legitimate means to settle political differences? How did we become so divided? One explanation is that we are seeing the cumulative impact of a sustained, covert, global cyber-war being waged against democracy. (For the record, I’m still in favor of having an equal say in government, and may the majority rule!)
We are under constant attack by the enemies of the world’s democratic societies. It is being waged through military-grade propaganda and disinformation campaigns using every means of mass communication. Make no mistake… it is organized, purposeful, and well-funded. The goal is to replace governments of the people with authoritarian rule and crony, unfettered capitalism.

Disinformation attacks take direct aim at our perceptions and feelings. They bypass normal filters and influence our subconscious. We feel these attacks when we read or hear something scandalous or shocking in the news that may not sound entirely true but still makes us feel extremes of anger towards the government, democratic institutions, opposing politicians, or neighbors. Our initial skepticism fades as these fictions stories are endlessly echoed over multiple media sources and from our online community of friends, some of whom may be fake accounts. We feel the effects of these attacks when we become uncharacteristically unsure about what to believe or who to trust. We become casualties in the cyber-war, or unwitting participants when we engage in verbal or physical attacks against friends, family, or strangers. We are casualties of war when our long-held belief systems are overturned in a relatively short time span. When friends or loved ones get upset and tell us we changed, we need to listen instead of justifying our feelings. They are in a better position to judge what is happening to us. There are very few internal warning signs when our perceptions and worldview are altered when under attack. It feels like we are still making our own choices when in fact we are being manipulated by targeted disinformation.

We must all learn more about cyber-warfare, how it works and how to recognize it. We must inoculate ourselves against it. There is a good article below on how Russia conducts its cyber-warfare, but they aren’t the only enemy of democracy. It is also helpful to reinforce our understanding of some basic terms about knowing when facts are true.
Many impasses in our fraught discussions boil down to completely different sets of facts between us and others. It’s like living in different universes. We need to state our facts, but we need to know how we sort fact from fiction. Under fire in an argument, folks who don’t share the same facts cause us to conflate terms like information, misinformation, and disinformation. They begin to would like roughly equivalent terms. When people under the influence of disinformation are confronted with verifiable facts, they may argue that all facts are really just someone’s opinion. That is a slippery slope towards chaos and disorder. When under pressure to produce data sources to verify their facts, people who are under the influence of propaganda strongly resist or refer you to their favorite websites instead of original source materials. Their denialism becomes apparent.
Here then are some defining terms and their relationship to what we believe to be true in the real world.
In an article published January 2020 in the British Journal of Sociology, Martin Innes defined disinformation this way:
“Disinformation can be defined as “deviant information.” For where information is imparted to enhance awareness, insight, and understanding, disinforming communications blend intent and action to distort, deceive, and dissemble.”
Disinformation – At its source, disinformation is a subset of propaganda. It is deliberately false information that is spread to deceive and cause harm. Also known as black propaganda, it is sometimes confused with misinformation. Disinformation may be comprised of knowingly false or fabricated data, intentionally biased, misleading, or fictitious rendering of the underlying data, or information devoid of any factual basis. Disinformation is never a real description of objects, people, or events in the world. It is, however, often embedded in truthful information to trick us into accepting it as true. Even misinformation can become disinformation when it is willfully represented as true even after it is known to be false. This is often the case on social media when individuals repost statements that they know to be misinformation. Disinformation is always intentionally harmful and corrosive to human understanding.
How is knowledge and understanding of the real world supposed to take place? It starts with data.
Data – Data are fundamental units of information about the real world. They are like the pixels that create a picture in a flat-screen TV. They are even more like sensory input from our eyes, or ears that our brain must then sort out and interpret. In a technical sense, data are a set of values of qualitative or quantitative variables about one or more persons or objects. They are building blocks of “facts” that can be transformed into information when viewed within a larger context. The expression, “check your facts” is a request to reexamine the underlying data for errors, omissions, faulty analysis, bias, etc. There are many ways that data can be in error, which includes intentional falsification.
Fact – A fact is a verbal statement of something that exists or happens in the natural world. It can be a single datum, or it can emerge from a coherent set of data pertaining to the real world. Either way, a fact must contain a high degree of certainty. If a statement of fact is later proven false it is no longer a fact. Facts can be thought of as subunits of information. They are assertions of confidence that its underlying data is accurate. Facts can be verified, replicated, observed by others, or logically derived. Facts cannot be metaphysical, hypothetical, To be a fact, it must accurately or fairly represent the current state of its underlying data. It must be testable in this regard. But that doesn’t mean must be durable over time. Facts must be true to the underlying data, but they may not represent absolute truth. Data evolves. It may progress, improve, or grow in unexpected directions over time. This drift of the underlying data requires altering the overlying facts. This can be a frustrating exercise for many people seeking certainty, including some scientists for whom this is a familiar feature.
Information – Information, in the everyday use of the word, is a verbal representation of an aspect or event in the world based on processed, organized, and structured sets of data-verified facts. Information conveys cognitive meaning within the context of our highest, most durable perception of natural reality. It provides a coherent contextual framework to understand the facts that emerge from very large sets of data. The information enables the type of higher-level decision-making of which we humans are capable. Information is usually more durable than facts or data because the overall picture can be correct even when some of the facts are less than certain.
Misinformation – Misinformation contains unintended errors of fact. It can result from faulty, misleading, or unintentionally omitted data, wrong assumptions, clerical errors, translational errors, measurements errors, etc. Misinformation is different from rumors which are purely speculative. Even if later retracted or corrected, misinformation can continue to influence the actions and memories of others. The outcomes of misinformation can be very harmful, so care must be taken to avoid misinformation. The diligence required to avoid misinformation should be at least proportional to the potential harm it could cause. Misinformation is an inevitable but correctable part of our understanding of the world.
Just keeping these concepts in mind as we consume content on social media or other media sources may help us our skepticism about what we see or read. Rather than surrender to those who push disinformation into our public discourse, we need to be proactive in checking our facts and stating them clearly, out loud, or in writing. This isn’t likely to change the mind of the person to whom you are responding, but many more impressionable online views need to see both sides of every argument. Do it for them. Not responding at all to propaganda and disinformation is tantamount to surrendering the battlefield to the enemies of truth and democracy.
The Bureaucracy Held, But is Our Past a Prelude to Violence?
The Bureaucracy Held, But is Our Past a Prelude to Violence?

by Brian T. Lynch, MSW
When an agency pisses off politicians, they complain or blame the “bureaucracy”. When an agency lives up to its righteous, legislated mission (especially when it is under pressure) it is called an “institution”. We are told that “our democratic institutions held.”
Keep that in mind as you read the news or listen to media broadcasts. I have a lifetime of experience working in a massive state bureaucracy at nearly every management level. I can tell you this for sure. When an agency of government has a clearly articulated and righteous mission, it is the front line and lower-level employees who best uphold the mission. The further up the chain of command you go, the more political pressure there is to avoid scandals or succumb to the chief executive’s ideology and political calculus.
The whole reason for a bureaucracy is to faithfully execute a legislative mission under the operations of the executive branch of government. Bureaucracies were created to resist mission drift or the whimsy of powerful people at the top. We often disparage bureaucracies, but if they didn’t exist (or hadn’t worked properly) Donald Trump would have gotten those 11,000 unearned votes in Georgia. Without the bureaucracy, Arizona might have sent a partisan slate of electors to Washington instead of those chosen by the people of that state.
From the Whitehouse to the most remote election polling places in America, democracy held last November because the front-line and lower-level agents of government faithfully did their jobs. They carried out their mission on the people’s behalf. If this past election had been a military operation abroad, these same people would have been lauded as heroes. Indeed they are. I thank them all. If this includes you, know that I appreciate your dedication and sacrifice.
And now, because they did their jobs, they and the institutions behind them are literally under attack. America’s workforce of “civilian soldiers” are living under threats of bodily harm to them and their children from misguided neighbors duped into believing the election was stolen. They are being driven out of their jobs and their homes by angry mobs amped up by power-hungry politicians who can’t win office on the basis of having superior ideas for governing this great and diverse nation. Republican state legislators throughout the country are devising and passing laws to overturn our democratic institutions. Where will it lead? When does it end?
Will our history be a prelude to future events?
In 1856 Senator Charles Sumner gave an impassioned anti-slavery speech on the Senate floor during which he unleashed a blistering verbal attack on Steven Douglas of Illinois and Andrew Butler of South Carolina. After the Senate adjourned, while Sumner was still in the chamber, Preston Brooks of South Carolina struck Sumner from behind with a cane and beat him nearly to death. Brooks was subsequently lionized for his violent actions in the South while the shock of violence galvinized the North to condemn the violence and speak out against slavery. The event revealed how polarized the country had become and how intractable the perceptions were of those living in the North and South. The schism ruptured on March 14, 1861, and the civil war soon followed.
Please God, let’s find a way to bridge our differences now to avoid such violence in the future.

On May 22, 1856, the “world’s greatest deliberative body” became a combat zone. In one of the most dramatic and deeply ominous moments in the Senate’s entire history, a member of the House of Representatives entered the Senate Chamber and savagely beat a senator into unconsciousness.
The inspiration for this clash came three days earlier when Senator Charles Sumner, a Massachusetts antislavery Republican, addressed the Senate on the explosive issue of whether Kansas should be admitted to the Union as a slave state or a free state. In his “Crime Against Kansas” speech, Sumner identified two Democratic senators as the principal culprits in this crime—Stephen Douglas of Illinois and Andrew Butler of South Carolina. He characterized Douglas to his face as a “noise-some, squat, and nameless animal . . . not a proper model for an American senator.” Andrew Butler, who was not present, received more elaborate treatment. Mocking the South Carolina senator’s stance as a man of chivalry, the Massachusetts senator charged him with taking “a mistress . . . who, though ugly to others, is always lovely to him; though polluted in the sight of the world, is chaste in his sight—I mean,” added Sumner, “the harlot, Slavery.”
Representative Preston Brooks was Butler’s South Carolina kinsman. If he had believed Sumner to be a gentleman, he might have challenged him to a duel. Instead, he chose a light cane of the type used to discipline unruly dogs. Shortly after the Senate had adjourned for the day, Brooks entered the old chamber, where he found Sumner busily attaching his postal frank to copies of his “Crime Against Kansas” speech.
Moving quickly, Brooks slammed his metal-topped cane onto the unsuspecting Sumner’s head. As Brooks struck again and again, Sumner rose and lurched blindly about the chamber, futilely attempting to protect himself. After a very long minute, it ended.
Bleeding profusely, Sumner was carried away. Brooks walked calmly out of the chamber without being detained by the stunned onlookers. Overnight, both men became heroes in their respective regions.
Surviving a House censure resolution, Brooks resigned, was immediately reelected, and soon thereafter died at age 37. Sumner recovered slowly and returned to the Senate, where he remained for another 18 years. The nation, suffering from the breakdown of reasoned discourse that this event symbolized, tumbled onward toward the catastrophe of civil war.
Property Tax Funding of Public Schools is Archaic and Unfair

by Brian T. Lynch, MSW
Our current property tax system is essentially a municipal flat tax on a very faulty measure of family wealth. It places more of a tax burden on poorer communities to pay for underfunded schools, while wealthy districts can easily afford excellent schools that better advantage their children.
Imagine if we had a wealth tax on stock ownership based on the purchase price of the shares you bought on margin, that is, you bought the stocks on credit. Your equity in those stocks might only be 15% of their value, but your municipality taxes you on the full value of the stock each year. (How would that sit with the moguls on Wall Street?) This is precisely how property taxes work. Even worse, imagine that you could forfeit ownership of all your stocks if you defaulted on tax payments to your town. No one would stand for that, yet that is how we pay for public schools in New Jersey and many other states.
Property taxes are also very regressive, overburdening the poor while benefiting the wealthy.
I live in New Jersey where the average total per-pupil cost in NJ 2017-2018 was $21,866. That is higher than most states. The majority of the revenue to pay for it comes from property taxes. New Jersey is an economically diverse state with among the richest towns in the country and towns that are very poor indeed, yet all our municipal school districts rely on local property taxes. The state’s average residential school tax bill in 2018 was $4,610 per household, about 52% of the total municipal tax bill. The rest pays for municipal services.
To relieve the unfair tax burdens created when economically depressed communities are unable to equitably fund public schools, the State collects an income tax, part of which is distributed to school districts that need financial assistance. The school aid formulas, however, are subjected to considerable political pressures resulting in unsatisfactory, often hotly disputed results. The overall funding complexities of how property taxes and state aid are calculated are nearly impossible to sort out and massively confusing for most taxpayers to fathom. No methods for directly comparing school taxes across municipal districts are perfect, but one of the better ways uses the “equalized tax rate”.
The equalized tax rate is what a homeowner’s tax rate would look like if every house in NJ was assessed at 100 percent of what it will get on the open market. The equalized tax rate is a guide to compare homeowners’ real tax burden across different towns. The average equalized tax rate in New Jersey was 2.287 percent in 2018. With this method and that median figure in mind, I grouped together five counties with the highest equalized tax rates (pays more per $100 in assessed property value) and the five counties with the lowest equalized tax rate. I then looked at the differences between these groups. It isn’t the greatest method, but it does bring out some of the inequities of property taxes.
The group of the five counties with the highest equalized tax rates in New Jersey is comprised of Camden (3.5%), Gloucester (3.2%), Passaic (3.0%), Warren (3.0%), and Cumberland (2.9%). The average of these five tax rates is 3.2 percent.
The group of five counties with the lowest equalized tax rates is comprised of Hudson (1.8%), Ocean (1.8%), Monmouth (1.8%), Bergen (2.2%), and Morris (2.2%). The average of these five tax rates is 1.9 percent.
The high tax rate group has less family income, $62,000 per year on average. The lower tax rate group has an average family income of $75,000 per year. The average value of homes in the high tax rate group is lower, $252,000, which is 72% less valuable than the average home value in the low tax rate group, which is $433,000.
Multiplying the average home values by the tax rate in the high tax rate group suggests a property tax bill of $7,762 per year, and a tax bill of $8,486 in the low tax rate group. The difference in property taxes between the wealthier and poorer groups is only 9.3%, yet the difference in family income is 21% more income in the low tax rate group. Also, residential properties are 72% less valuable in the high tax rate/low-income group than in the wealthier-low tax rate group.
The argument has been made that the wealthier communities have fewer, but more expensive homes, and therefore homeowners pay more in property taxes. This is true in actual dollars per year, but it is not true in terms of property taxes bills as a percentage of family income or of the wealth, or future equity both groups will acquire in the years that their children are in school. As a form of wealth tax, local property taxes place a much higher burden on less wealthy communities. The band-aid we apply in New Jersey to fix the inequities, state aid to supplement educational costs in poorer communities, is a poor substitute for a more equitable school funding plan.
What might a better system look like?
First, it would have to start with a better organizing structure. We have too many local districts. The disparities between local districts are far wider than even the disparities between counties. And the administrative costs of maintaining so many districts are enormous.
We need to regionalize school districts in ways that create fewer districts that are more ethnically, racially, and economically diverse. New Jersey already has the second most segregated public school district in the nation. That has to end.
Next, instead of a flat property tax rate for each municipality (now the regions under this new plan), I would introduce a graduated property tax rate schedule based on family income levels. Income levels, in this system, would serve as a secondary indicator of the wealth of a homeowner. And for this measure, I would treat all income equally. A dollar of capital gains reported would count the same as a dollar in wages, for example.
There is no shortage of other ideas about how tax burdens can be more fairly distributed, and the whole topic of tax fairness (writ large) is a conversation that America needs to have.
99-Year-Old ‘Piano Man’ Lights Up the Internet
by Brian T. Lynch, MSW
This blog is to honor my 99-year-old father-in-law, Henry Shapiro. He has been playing piano professionally since he was 13 years old and is now performing on Facebook Live every Saturday at 5:00pm to help lift everyone’s spirits during this pandemic. He is an inspiration to his many fans. You can learn more about him via his Facebook page (run by his wife)
Henry was featured on CBS News recently.
Search Results
Web results
99-Year-Old ‘Piano Man’ Lights Up Internet, Brings Joy In Face …
newyork.cbslocal.com › 2020/04/22 › coronavirus-cov…
Apr 22, 2020 – MORRIS COUNTY, N.Y. (CBSNewYork)
The following is a link to a feature About Henry that was recently published by NJ.com, a New Jersey news organization. http://nj-ne.ws/AD4BNdh
For your enjoyment, I am posting YouTube links to just a few of his Saturday at 5pm concerts. For more, search him in YouTube using “Henry Hank Shapiro” Feel free to share these with friends and especially with parents or grandparents who would appreciate Henry’s style and song selections.

28:55NOW PLAYINGWATCH LATERADD TO QUEUE
Henry Hank Shapiro June 6, 2020
•
102 views3 weeks ago
Hank will be 100 in September 2020. Enjoy his Saturday pandemic gig! https://www.youtube.com/watch?v=0zzVwl-9z20

Henry “Hank” Shapiro March 28, 2020
•
253 views3 months ago
5 pm Concert #3. Henry Shapiro, 99 1/2, live streaming during the pandemic.https://www.youtube.com/watch?v=WRbsfP9M79s

Henry Hank Shapiro June 27, 2020
•
52 views3 days ago
Hank will be 100 in Sept! You can hear his passion for music in this Sat live Facebook gig during the pandemic. https://www.youtube.com/watch?v=tXC62YMQ9A8&t=102s

Henry Hank Shapiro 99 years old
•
Vote-by-mail is NOT Safe From Executive Power
by Brian T. Lynch, MSW

I have a different view on mail-in ballots than most. Yes, it has been safe and very beneficial in the past. The question is how safe is an election against a determined attack by a ruthless potentate? That is the question we must answer. The potential vulnerabilities of vote-by-mail against threats by the Executive Branch to undermine or discredit an election are very significant. Elections are state functions.
Each state has full constitutional authority and autonomy to conduct its own elections. There are no national elections in the United States. That is perhaps the most fundamental separation of power in the Constitution that most of us don’t think of when we think of checks and balances.
To the extent that a state relies on the US Postal Service to handle state election ballots, it surrenders some of that autonomy to the federal government. It is a massive vulnerability because the U.S. Postal Service is under the direct control of the Chief Executive, Donald Trump.
We have already seen moves by the President to exploit this vulnerability when he installed an acting Master General, Louis DeJoy, on June 15, 2020. DeJoy was a top fundraiser for Donald Trump and the Republican National Party and a stalwart ally of the President. DeJoy is the first Postmaster General in 20 years with no prior experience at the U.S. Postal Service. He was president of LDJ Global Strategies, a Greensboro, North Carolina-based, boutique firm with interests in real estate, private equity, consulting, and project management.
When DeJoy began his tenure as 75 Postmaster General, he immediately began implementing sweeping changes to USPS operations in the face of backlash from unions, employees, and lawmakers. USPS announced a reorganization and corresponding executive shakeups that have already degraded the reliability of the USPS. Congress has expressed concern that new Postmaster DeJoy was consolidating power within the organization. The net effect has been slower mail delivery and a growing fear that the USPS will not be able to handle the great volume of mail that is expected due to huge numbers of mail-in-ballots.
When President Trump says that mail-in-voting will create a mess in this election, that isn’t a prediction… it is a direct threat by a man who is already acting to deliver on it.
And that isn’t the only vulnerability of mail-in voting. But focusing on the US Postal Service, there are a number of things that could help mitigate the threat of missing or late ballot deliveries. Proper handling of mail-in voting by mail might alleviate the vulnerability.
Maintaining the chain of custody
All mail-in ballots could be sent by certified mail with a return receipt request. Currently, the normal chain of custody in a state election is maintained in most states. Pickups by postal workers break that chain of custody. There is no proof that your ballot was picked up, and not stolen out of your mailbox, or from a mail drop. There is no way to track your envelope or ensure it has been delivered.
If your ballot is misplaced before it is date stamped at the Post Office, there is no way to prove you sent it before election day. If the USPS is going to play a vital part in a state election, vote-by-mail ballots should all be handled as certified mail, at no cost to the voter. Congress should allocate money to the US Postal Service to defray the cost to certify every mail-in ballot.
Additionally, every state board of election office collecting and processing the ballots should receive an electronic list of who has mailed every ballot being sent by certified mail. When the ballots are received at the Boards of the election, the return receipts and mail-in ballot should be timestamped as having been received in the office and the verified delivery cards returned to the voter. This would go a long way in securing vote-by-mail ballots.
Postscript from 8/13/2020. Trump says it out loud:

Daily Pandemic Diary for August – U.S.National Health Emergency
U.S.National Health Emergency – The 2020 Pandemic
by Brian T. Lynch, MSW
(If you are returning to this site skip down to today’s data table and comments section below)
Welcome to the Daily Pandemic Diary for August. This report is divided into four parts, the U.S. daily global share of new cases in the prior 25 hour period, the U.S. daily global share of COVID-19 related deaths in the same 24 hour period, a daily commentary on the trends and related issues, and a graphic of the table from which the raw data is reported. The raw data all comes from the international Worldometer.info website. The main purpose here is to provide a daily snapshot of how the U.S. is doing relative to the world as a whole. For example, if we have 4.3% of the world’s population but 20% of the new cases, that isn’t very good. If 18 other countries are testing more of their people per million population than are we, that is an indication that we must do better, etc. The twenty-four-hour lookback is based on Grenich Mean-time. The Total Tests/U.S. Population is the ratio of all COVID-19 tests given relative to the population of only one test was given per person.
This blog continues the daily collection of data begun in the blog mentions below. Daily additions to that blog became cumbersome, therefore future daily diaries with be added to a blog for each month.
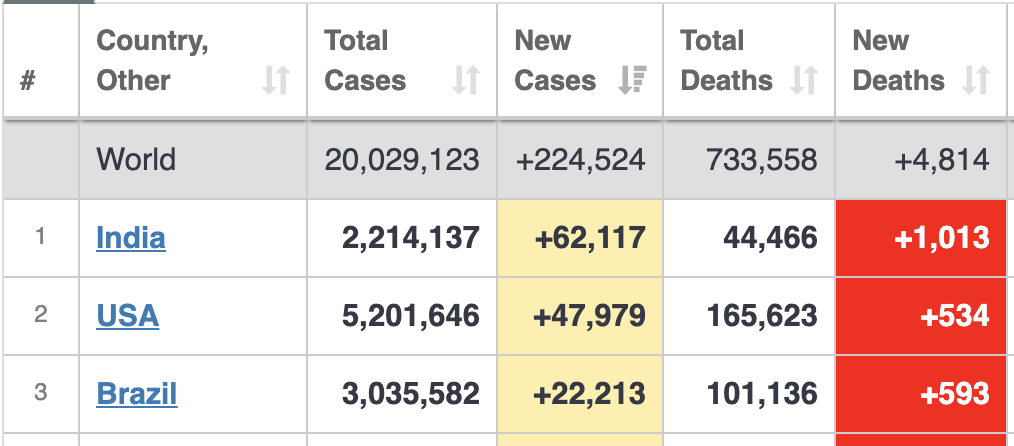
U.S. National Health EmergencyDay 161 – August 22, 2020

Comments: Things have yet to turn around. It can all be challenging and depressing at times. So, today I wanted to offer up the numbers with uplifting words of hope written in another time when the world was darkness and great upheaval.
Desiderata
GO PLACIDLY amid the noise and the haste, and remember what peace there may be in silence. As far as possible, without surrender, be on good terms with all persons.Speak your truth quietly and clearly; and listen to others, even to the dull and the ignorant; they too have their story.Avoid loud and aggressive persons; they are vexatious to the spirit. If you compare yourself with others, you may become vain or bitter, for always there will be greater and lesser persons than yourself.Enjoy your achievements as well as your plans. Keep interested in your own career, however humble; it is a real possession in the changing fortunes of time.Exercise caution in your business affairs, for the world is full of trickery. But let this not blind you to what virtue there is; many persons strive for high ideals, and everywhere life is full of heroism.Be yourself. Especially do not feign affection. Neither be cynical about love; for in the face of all aridity and disenchantment, it is as perennial as the grass.Take kindly the counsel of the years, gracefully surrendering the things of youth.Nurture strength of spirit to shield you in sudden misfortune. But do not distress yourself with dark imaginings. Many fears are born of fatigue and loneliness.Beyond a wholesome discipline, be gentle with yourself. You are a child of the universe no less than the trees and the stars; you have a right to be here.And whether or not it is clear to you, no doubt the universe is unfolding as it should. Therefore be at peace with God, whatever you conceive Him to be. And whatever your labors and aspirations, in the noisy confusion of life, keep peace in your soul. With all its sham, drudgery and broken dreams, it is still a beautiful world. Be cheerful. Strive to be happy.By Max Ehrmann © 1927
Original text


U.S. National Health EmergencyDay 160 – August 21, 2020

Comments: To put this country’s pandemic performance into an international perspective, consider how the ranking of nations would change if California, Texas, and Florida were their own countries. As of yesterday, subtracting the total new cases from these three states would only drop the U.S. from second-most new infections to third place. At the same time, California would rank 7th, Texas would rank 9th and Florida would rank 12th out of 218 nations. This is really bad. We can and must do better.
As the Summer begins to fade it is time to consider what we have learned about the virus before we shift more of our activity indoors. We know that the principal means of transmission is from what we exhale and inhale and that the biggest threats come from the largest moisture droplets we expel when we breathe, talk, cough, sing or sneeze. Hence the continuing need for masks and social distancing.
We have also learned that the virus can be present in the much smaller aerosol form. The virus load of these microscopic moisture particles is small. Short exposures to low concentrations of aerosols are unlikely to cause infections, but extended breathing by an infected person is a smaller space with little ventilation that will concentrate the aerosol virus load to infectious levels.
N95 masks have small enough pores to filter out most aerosols, but they are not effective in stopping aerosol transmission because where masks contact our skin there are always gaps that let in these aerosols. These gaps also allow aerosols to escape. So as we migrate indoors, how do we keep the air safe when people gather to socialize.
Vox News just published an article on this subject. In summary, there are three basic ways to keep indoor air as safe as possible. First is to limit the size and length of time for indoor gatherings, especially in smaller rooms, and to wear masks when non-household members are visiting.
The second is to have as much fresh-air exchange as possible. So, window fans or heating systems that have air exchangers might be examples. Leaving the bathroom vent fans running during and immediately after visits, might be a good idea, as long as the bathroom windows are closed. This creates a negative pressure that prevents the air in the bathroom from entering the rest of the living space. Air-exchange is always possible and is never simple. You don’t want the flow of air in a home or business to carry a virus in the air from an infected person past the uninfected people, for example.
The third way to make indoor air safer is to filter the air using a properly equipt portable HEPA filter. HEPA filters have the same pore size and filtering capacity as an N95 mask. A properly sized air filter can exchange the volume of air in a room multiple times per hour. When you are entertaining guests and they are wearing masks (while not eating or drinking), a HEPA filter in the room will slow or reduce the build-up of virus-carrying aerosols making the room safer for all.

U.S. National Health EmergencyDay 159 – August 20, 2020
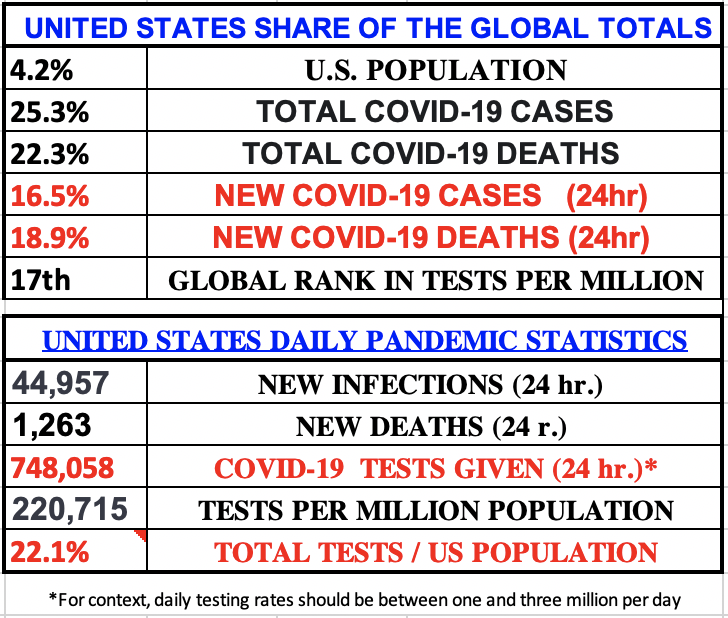
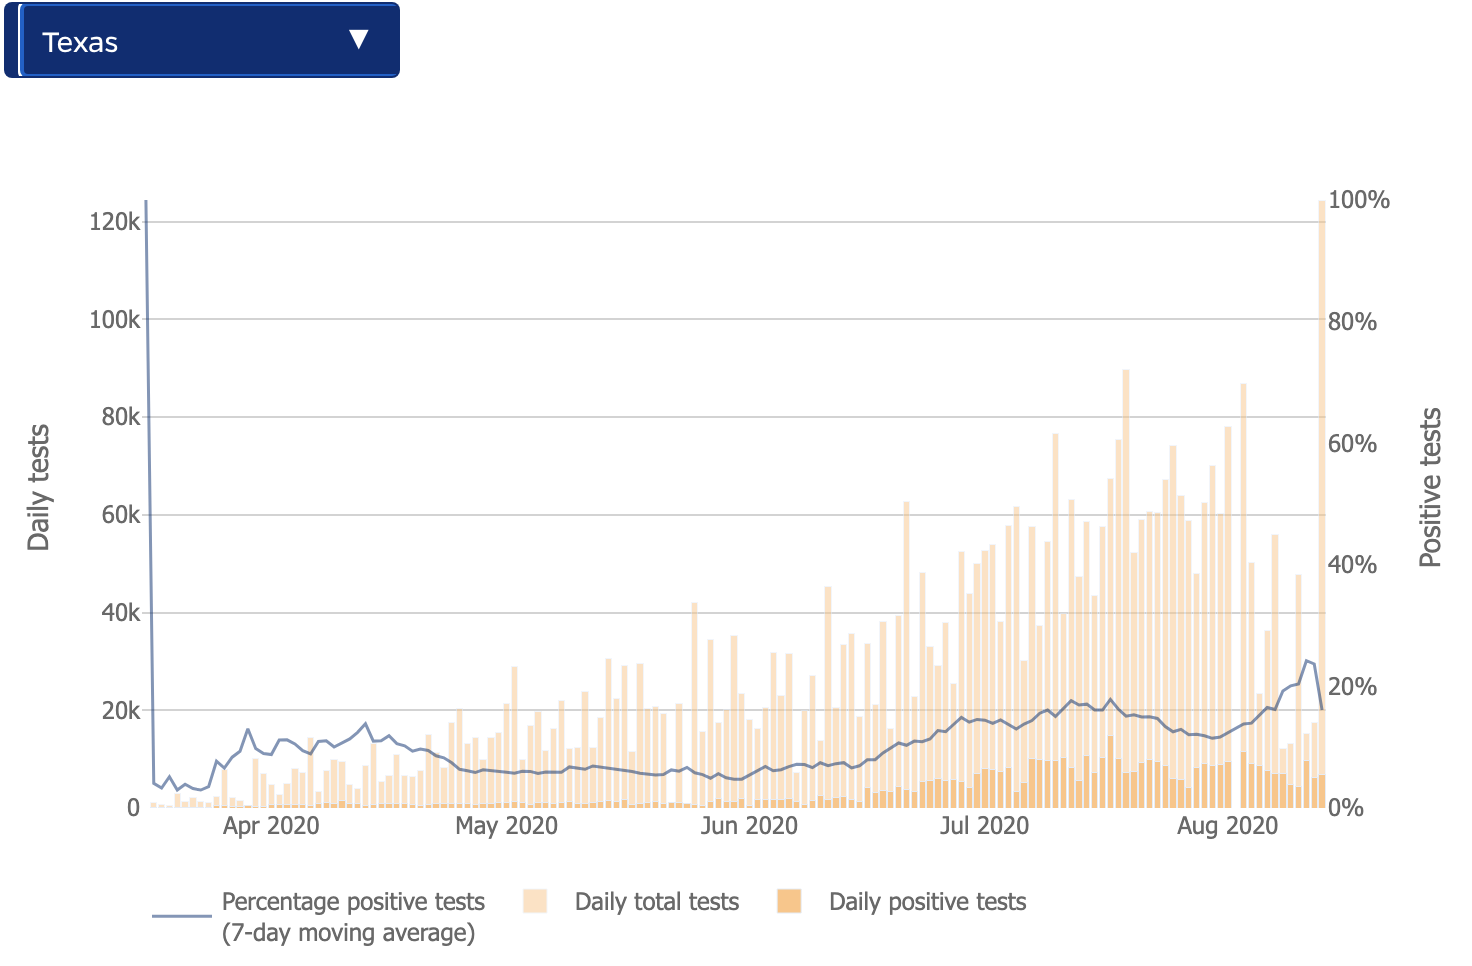
Comments: One out of four COVID-19 infections around the world have happened here in the United States and new infections rates are still four times higher than expected given our population. Testing is still lagging behind given our case numbers, especially in the states of Florida, Texas where more testing is badly needed. As mentioned a few days ago, testing rates have declined by about 13% in the past two weeks prompting some reporting that suggests fewer tests is a way to suppress the reporting of daily new cases for political reasons in some states. If this is happening we should see a decline in both testing and cases with positive test rate either stable or trending upward, not downward (unless people with symptoms are not being tested while those without symptoms are being tested in greater numbers.)
A visual review of available data on testing and new case reporting suggests that this might be happening in some states, but it isn’t conclusive. A more sophisticated statistical analysis would be needed. Some of the visual data I looked at is included below. (continue viewing at Data-Driven Viewpoints blog)
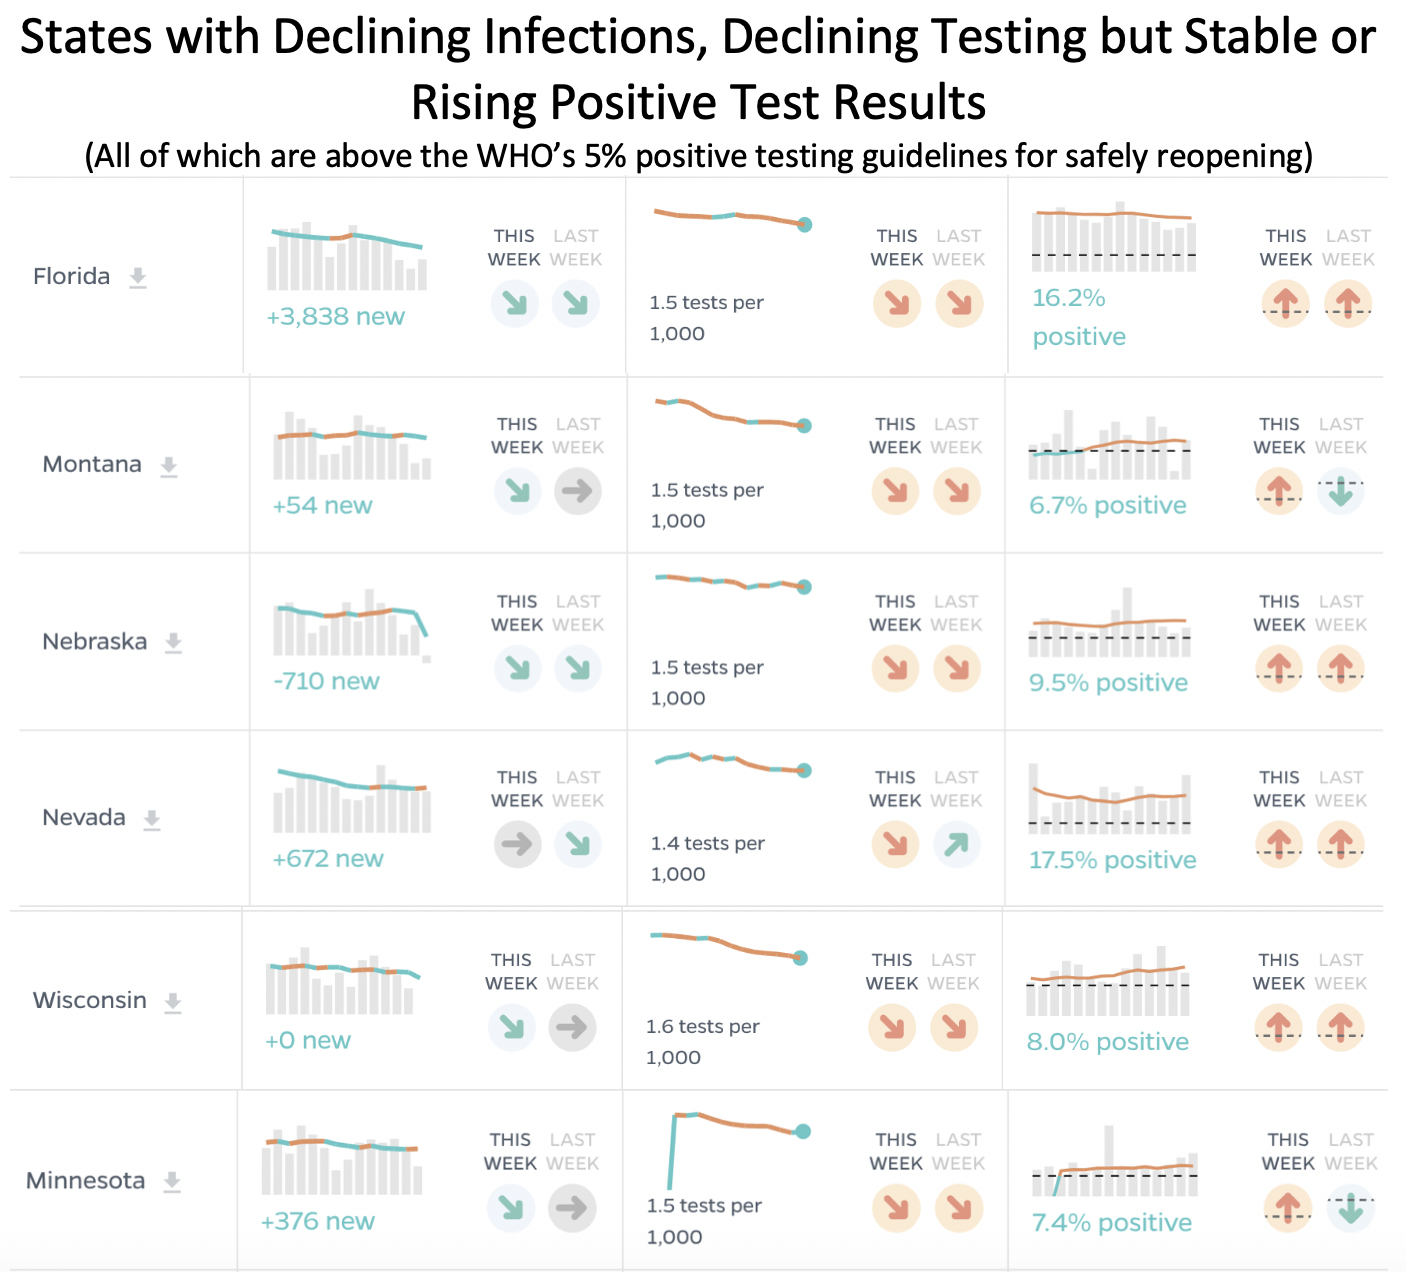

These are the states that suggest a relationship between testing and new case reporting. There are other states where the data gives a mixed result, so, absent a more refined statistical analysis, this visual inspection of the data appears to inconclusive.


U.S. National Health EmergencyDay 158 – August 19, 2020

COMMENTS: [no comments today]

U.S. National Health Emergency
Day 157 – August 18, 2020
UNITED STATES SHARE OF THE GLOBAL TOTALS04.2% …………… U.S. POPULATION25.5% …………… TOTAL COVID-19 CASES22.4% ………….. TOTAL COVID-19 DEATHS 20.5% …………… NEW COVID-19 CASES (24hr) 13.7%. ………….. NEW COVID-19 DEATHS (24hr) 17th ………….. GLOBAL RANK IN TESTS PER MILLION
UNITED STATES DAILY PANDEMIC STATISTICS
40,612 ………… NEW INFECTIONS (24 hr.)
522 …………. NEW DEATHS (24 r.)
727,151 …….…… COVID-19 TESTS GIVEN (24 hr.)
216,412* …………. TESTS PER MILLION POPULATION
21.6% …………. TOTAL TESTS / US POPULATION
* For context, daily testing rates should be between one and three million per day.
COMMENTS: We rose a rank, to 17th, in tests per million but we are still far short of any reasonable goal for daily testing. Other nations that have the their numbers under control require less daily testing than countries that have very high infection rates. USA Today reports that “As testing has slowed, positive rates increased over the past week in 35 states as of Friday, according to Johns Hopkins University’s Coronavirus Resource Center. ” On Sunday the New York Times also reported on the declining trend in testing and reiterated the point that the number of tests given per day in the United States should be in the millions to effectively fight the spread of the disease. Business Insider reported that the decline in testing over the past two weeks amounts to a 13% reduction. And CBS News has pointed out that the decline in testing calls the accuracy of COVID-19 data into question. As testing declines, so do the number of reported positive cases. At the same time, less testing means that only symptomatic people are getting tested, which raises the positivity rates. High positivity rates and dropping numbers of new cases appears to be evident in a number of states. The fear, of course, is that the testing decline may be a harbinger of political manipulations to justify political goals.

U.S. National Health Emergency
Day 156 – Monday, August 17, 2020
UNITED STATES SHARE OF THE GLOBAL TOTALS04.2% …………… U.S. POPULATION25.5% …………… TOTAL COVID-19 CASES22.4% ………….. TOTAL COVID-19 DEATHS 17.3% …………… NEW COVID-19 CASES (24hr) 11.5%. ………….. NEW COVID-19 DEATHS (24hr) 18th ………….. GLOBAL RANK IN TESTS PER MILLION
UNITED STATES DAILY PANDEMIC STATISTICS
36,843 ………… NEW INFECTIONS (24 hr.)
522 …………. NEW DEATHS (24 r.)
862,664 …….…… COVID-19 TESTS GIVEN (24 hr.)
214,220* …………. TESTS PER MILLION POPULATION
21.2% …………. TOTAL TESTS / US POPULATION
* For context, daily testing rates should be between one and three million per day.
COMMENTS: The United States remains second in new infections over the past 24 hours despite a large drop in cases, which might be due to the usual weekend reporting lag. Close attention must be paid to the reports of the number as we approach the election because the potential for manipulation has grown substantially.
For decades, and up until June 20th, the CDC got all their health statistics directly from the hospitals and other medical centers. These statistics were also sent out by health care providers to the states’ Departments of Health.
Now President Trump has created something called the “HHS Project” and diverted all COVID-19 statistical reporting to his own cabinet agency. Hospitals and health organizations no longer submit their data directly to the CDC.
But the HHS Project does not get the daily data directly from hospitals either. The Trump administration gave a 10 million dollar, no-bid, six-month contract to TeleTracking Technologies to create an interface website program to which hospitals must report their daily statistics. From there, the information is transmitted to another private vendor, Palantir Technologies, for data processing services. Palantir is a privately held, Republican-friendly company that is going public in what is expected to be the biggest IPO this year. Business Insider Magazine described Palantir this way in a July 7th article:
“Palantir, a secretive tech company started by members of the ‘PayPal mafia’ with close ties to the Trump administration, could be one of the biggest tech IPOs ever. Take a closer look at how it makes money”
After Palantir is done with the data, it then goes to HHS to be channeled back to the CDC and every other scientific enterprise that is a consumer of the data.
I feel less confident with the numbers going forward now that they go directly to two private vendors before landing in HHS under our President’s direct control. I don’t care who the President is, this isn’t right. It increases the temptation to alter the data for political effect.


U.S. National Health Emergency
Day 155 – Sunday, August 16, 2020
UNITED STATES SHARE OF THE GLOBAL TOTALS04.2% …………… U.S. POPULATION25.6% …………… TOTAL COVID-19 CASES22.5% ………….. TOTAL COVID-19 DEATHS 20.6% …………… NEW COVID-19 CASES (24hr) 19.8%. ………….. NEW COVID-19 DEATHS (24hr) 18th ………….. GLOBAL RANK IN TESTS PER MILLION
UNITED STATES DAILY PANDEMIC STATISTICS
53,523 ………… NEW INFECTIONS (24 hr.)
1,071 …………. NEW DEATHS (24 r.)
735,975 …….…… COVID-19 TESTS GIVEN (24 hr.)
212,002* …………. TESTS PER MILLION POPULATION
21.2% …………. TOTAL TESTS / US POPULATION
* For context, daily testing rates should be between one and three million per day.
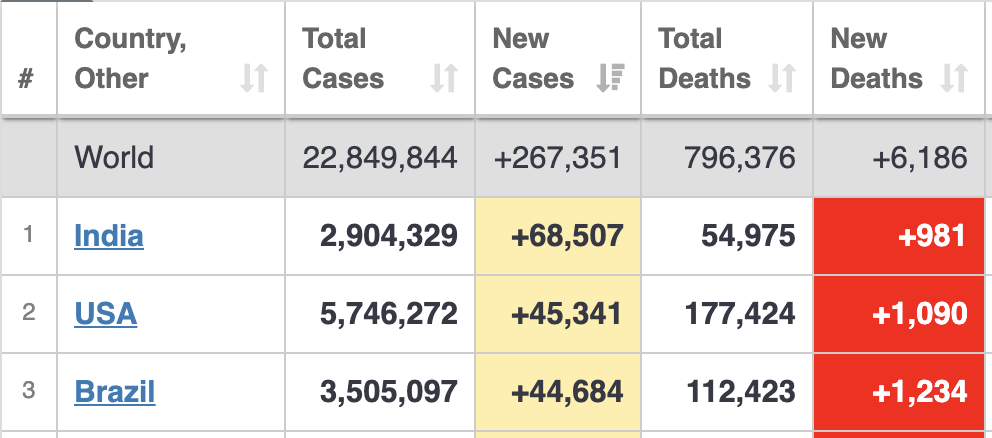
COMMENTS: The United States had the second-highest number of new infections yesterday behind India, and we were first in the number of COVID deaths. But how is the most powerful country in human history doing internationally on other pandemic measures? As reported above, we are 18th in the number of COVID-19 tests per million. How are we ranked on deaths per million population, for example?
The U.S. has one of the top-rated healthcare systems in the world (even though it cannot be accessed by everyone), so you would expect us to do better than most other countries. You would be wrong. We are ranked:
- 10th from the bottom in the highest number of deaths per million out of 215 countries
- 8th from the bottom in cases per million
- Dead last with the high number of critically ill COVID-19 patients (over 17 thousand), and with just 4.2% of the world’s population (yes it dropped 0.1% recently)
- We are ranked dead last with the highest number of currently active cases (2.9 million are sick)
For comparison sake, India with a billion more people has about 9k critically ill patients and 700k active cases while Brazil has 8k patients who are critically ill and 800k active cases as of today.
The point here, in fact, the point of this whole diary, is to make explicit the abject failure of national leadership in the United States relative to every other country in the world. Our great nation can’t seem to punch its way out of the global pandemic. We can’t even convince everyone that this virus is real.


U.S. National Health Emergency
Day 154 – Saturday, August 15, 2020
UNITED STATES SHARE OF THE GLOBAL TOTALS04.3% …………… U.S. POPULATION25.7% …………… TOTAL COVID-19 CASES22.5% ………….. TOTAL COVID-19 DEATHS 21.2% …………… NEW COVID-19 CASES (24hr) 18.8%. ………….. NEW COVID-19 DEATHS (24hr) 18th ………….. GLOBAL RANK IN TESTS PER MILLION
UNITED STATES DAILY PANDEMIC STATISTICS
60,600 ………… NEW INFECTIONS (24 hr.)
1,120 …………. NEW DEATHS (24 r.)
837,407 …….…… COVID-19 TESTS GIVEN (24 hr.)
209,401* …………. TESTS PER MILLION POPULATION
20.9% …………. TOTAL TESTS / US POPULATION
* For context, daily testing rates should be between one and three million per day.
COMMENTS: The U.S. was the second hottest hot-spot for new infections yesterday as California, Florida, and Texas still struggles to control their outbreaks. Here is some other tidbits of news for today:
- A pregnancy study published in Open Forum Infectious Diseases on August 13, 2020, reviewed 11,308 cases of SARS-CoV-2 infections and/or COVID-19 disease when pregnant showed that health outcomes were generally favorable for both the mothers and newborns. Maternal and neonatal survival was reassuring, (98%) and (99%), respectively.
- The U.S CDC updated their coronavirus guidance on August 3, 2020, suggesting that people who have recovered from COVID-19 related infections can reduce their social-distancing efforts for the next 3-months, because of limited immunity.
- As of August 12, 2020, the U.S. FDA says the food supply is safe and there is no evidence the coronavirus is transmitted through food, food containers, or food
- To expand the number of blood plasma donations, LabCorp announced on August 11, 2020, details of a no-charge antibody testing program. For the next 3-months, LabCorp will perform the high-affinity coronavirus antibody test at no-charge to patients, insurance companies, or the government.
If you think this sort of summary of coronavirus news is helpful, you can find these stories and more at the Corona Virus Today website.

U.S. National Health Emergency
Day 153 – Friday, August 14, 2020
UNITED STATES SHARE OF THE GLOBAL TOTALS04.3% …………… U.S. POPULATION25.7% …………… TOTAL COVID-19 CASES22.5% ………….. TOTAL COVID-19 DEATHS 19.5% …………… NEW COVID-19 CASES (24hr) 19.3%. ………….. NEW COVID-19 DEATHS (24hr) 19th ………….. GLOBAL RANK IN TESTS PER MILLION
UNITED STATES DAILY PANDEMIC STATISTICS
55,364 ………… NEW INFECTIONS (24 hr.)
1,301 …………. NEW DEATHS (24 r.)
973,441 …….…… COVID-19 TESTS GIVEN (24 hr.)
206,876* …………. TESTS PER MILLION POPULATION
20.7% …………. TOTAL TESTS / US POPULATION
* For context, daily testing rates should be between one and three million per day.
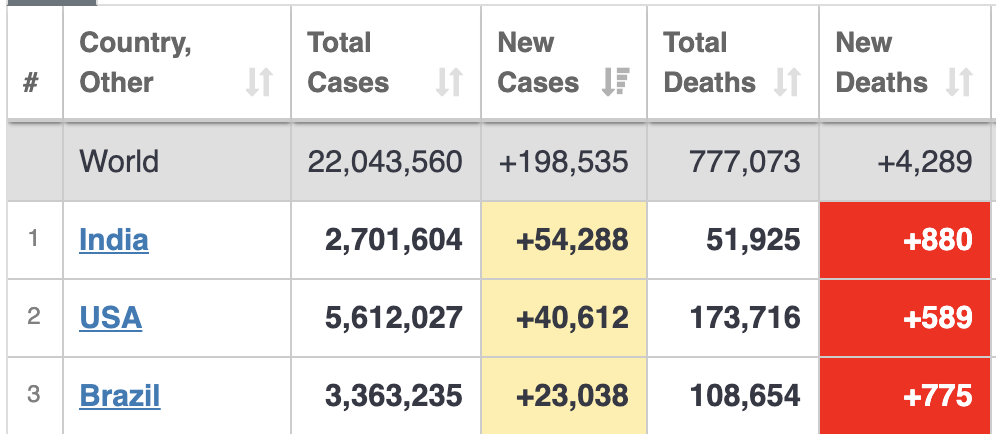
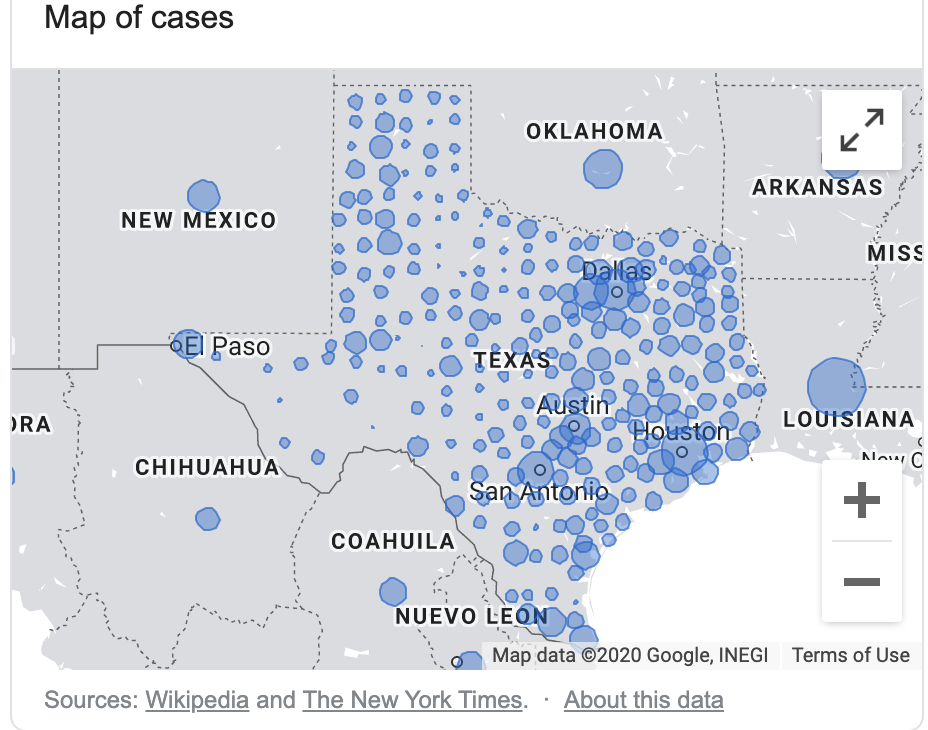
COMMENTS: While the U.S. is still third in total new cases over the past 24 hours, over 1 in 4 new cases globally are here in America. California, Texas, and Florida are still the top hot-spots. John Hopkins publishes daily testing trends by state. It shows that Texas has the highest rate of positive results at 23.7%. (I don’t trust today’s numbers because you would have to believe that daily testing jumped up from 17k per day to 124k yesterday, dropping the 7-day running average 7% in a single day. The prior record testing day was less than 90k tests). Florida’s positive testing rate is 17.7%, South Carolina’s is 14.3%, Georgia’s is 10.9%, California’s is 6.7% and North Carolina’s is 6%. In contrast in New Jersey, where the virus is under better control, the positive test rate is 1.7%. The other surprising feature about Texas is how spread out the outbreaks are given the sparse population in large areas of state (see map). Nationally, the seven-day average positive COVID-19 test ratio is 7.2% and starting to trend downward.


U.S. National Health Emergency
Day 152 – Thursday, August 13, 2020
UNITED STATES SHARE OF THE GLOBAL TOTALS04.3% …………… U.S. POPULATION26.0% …………… TOTAL COVID-19 CASES22.7% ………….. TOTAL COVID-19 DEATHS 19.0% …………… NEW COVID-19 CASES (24hr) 20.3%. ………….. NEW COVID-19 DEATHS (24hr) 19th ………….. GLOBAL RANK IN TESTS PER MILLION
UNITED STATES DAILY PANDEMIC STATISTICS
54,345 ………… NEW INFECTIONS (24 hr.)
1,386 …………. NEW DEATHS (24 r.)
608,804 …….…… COVID-19 TESTS GIVEN (24 hr.)
203,940* …………. TESTS PER MILLION POPULATION
20% …………. TOTAL TESTS / US POPULATION
* For context, daily testing rates should be between one and three million per day.
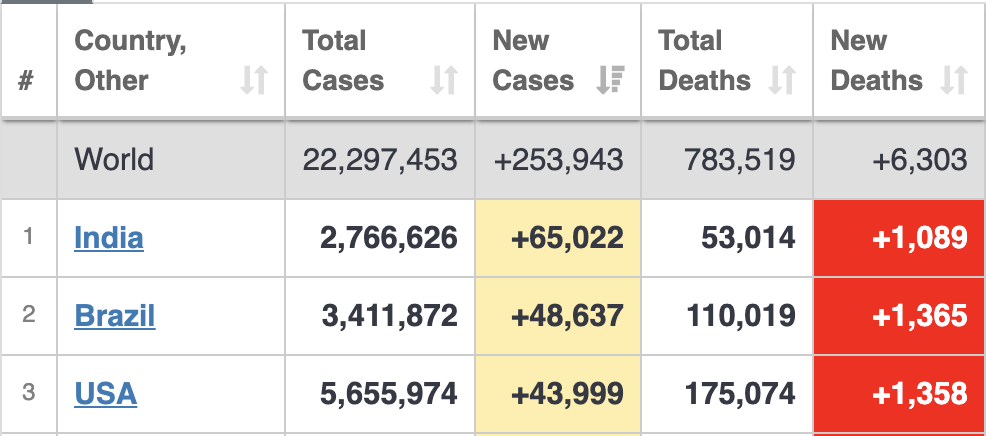
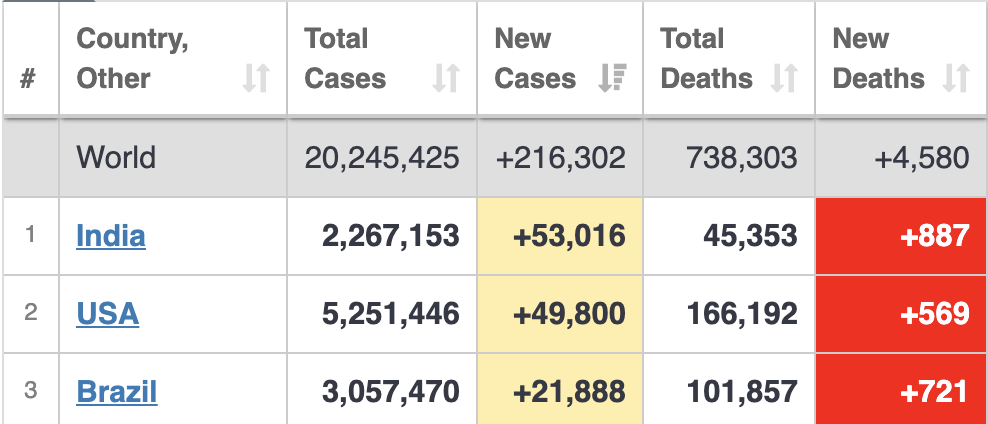
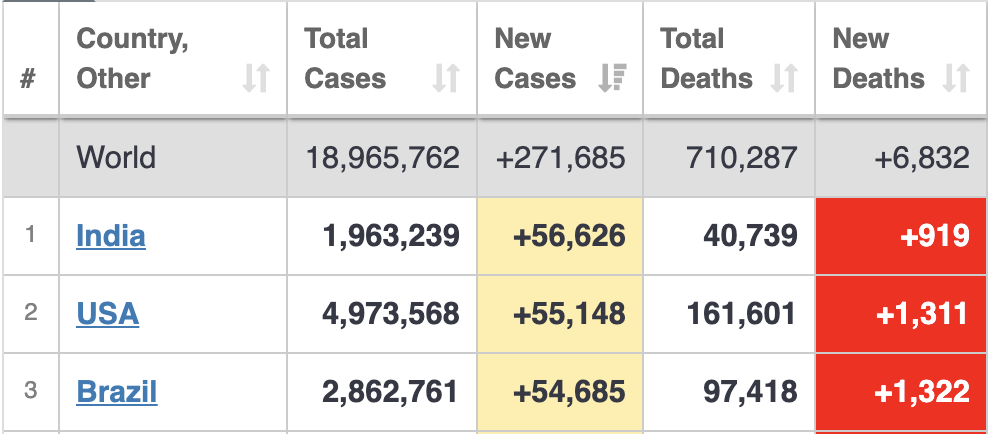
COMMENTS: The U.S. had the third-highest number of new infections in the world again yesterday behind India and Brazil, and again had the most COVID-19 deaths in the world yesterday. Texas had more COVID-19 deaths yesterday. But instead of focusing on our troubles today, it might be interesting to focus instead on Ireland, a county that has been far more successful in managing the pandemic.
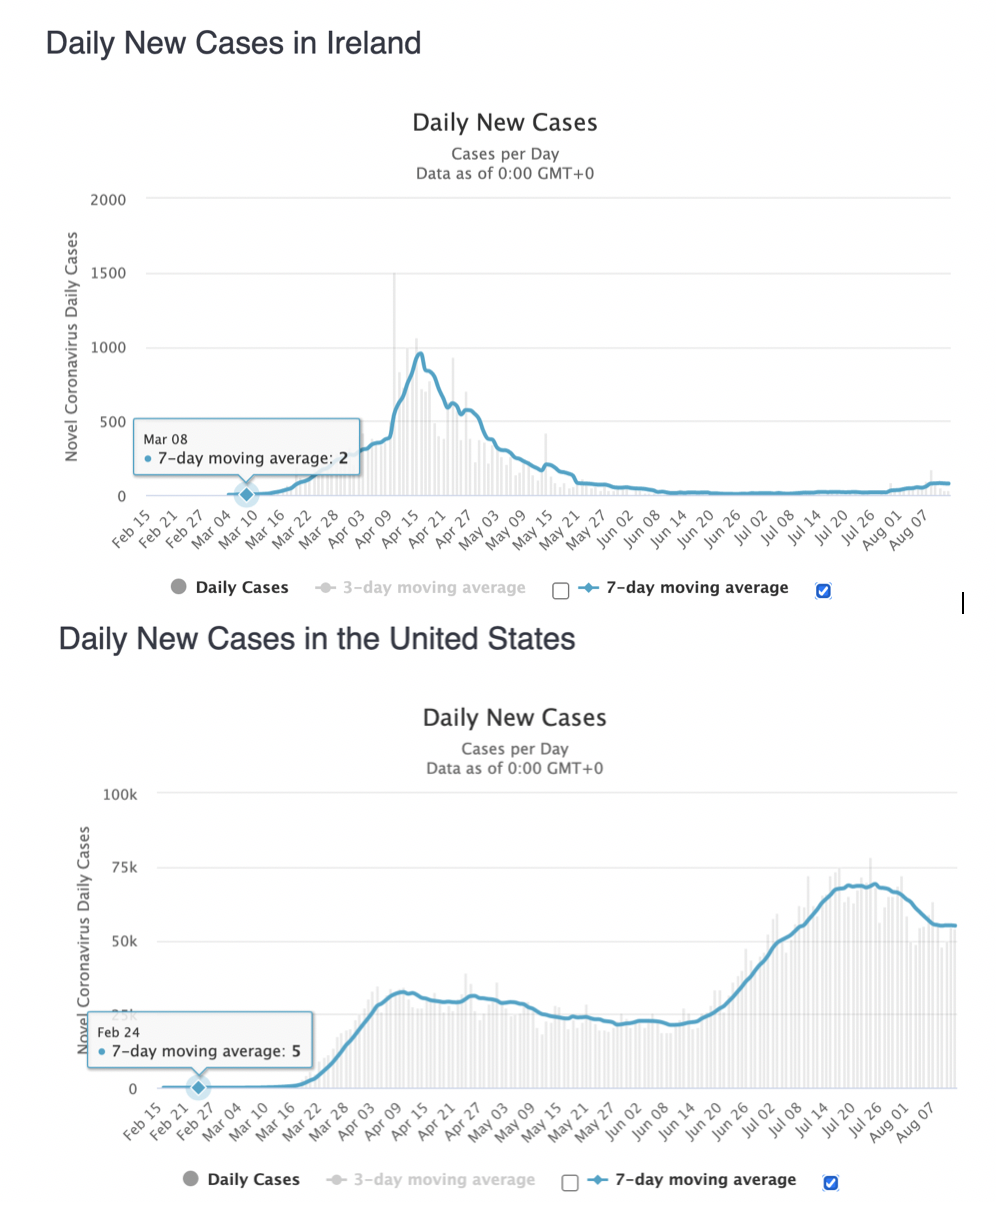
The graph below elegantly shows how successful Ireland has been in getting control of the virus versus the United States. As it happens, this blogger has close family connections there who have provided ongoing commentary on the Irish pandemic experience.
The Irish government recognized the pandemic threat early and acted more quickly and decisively than did we to bring it under control. In fairness, Ireland is about the size of Indiana. The first case of COVID-19 occurred on February 29th in the Republic of Ireland. Twelves days later the public schools were shut down. The pubs shut their doors that weekend and haven’t opened since. Tens of thousands of citizens were already put out of work due to the restriction by March 12th, and by March 16th the government established the pandemic unemployment payment of €203 a week. This later rose to €350 (about $415, but no one lost medical coverage which is free for everyone).

By the end of March, almost 400,000 people had applied for the payment. A full account of their Irish response can be found at this hyperlink.
Early on Irish authorities recognized that the elderly were at greater risk from the virus and established tighter restrictions on everyone over 65 years old. This population was not allowed to leave their residential properties or travel on the roads or go shopping. If their shopping needs and other personal needs could not be arranged through family, friends, or neighbors, the government sent workers to every shut-in to bring them groceries, medicines, and other essentials. To enforce this restriction check-points were set up on the roads to check the ager of the occupants in their vehicles. Rather than railing against this restriction, the elderly saw it as their contribution to the health of their neighbors and called it “cocooning.”
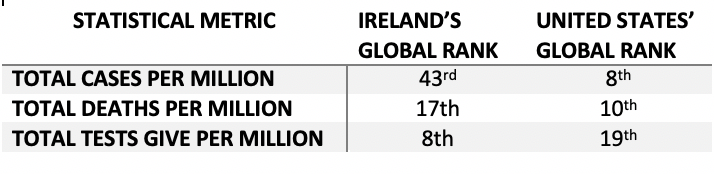
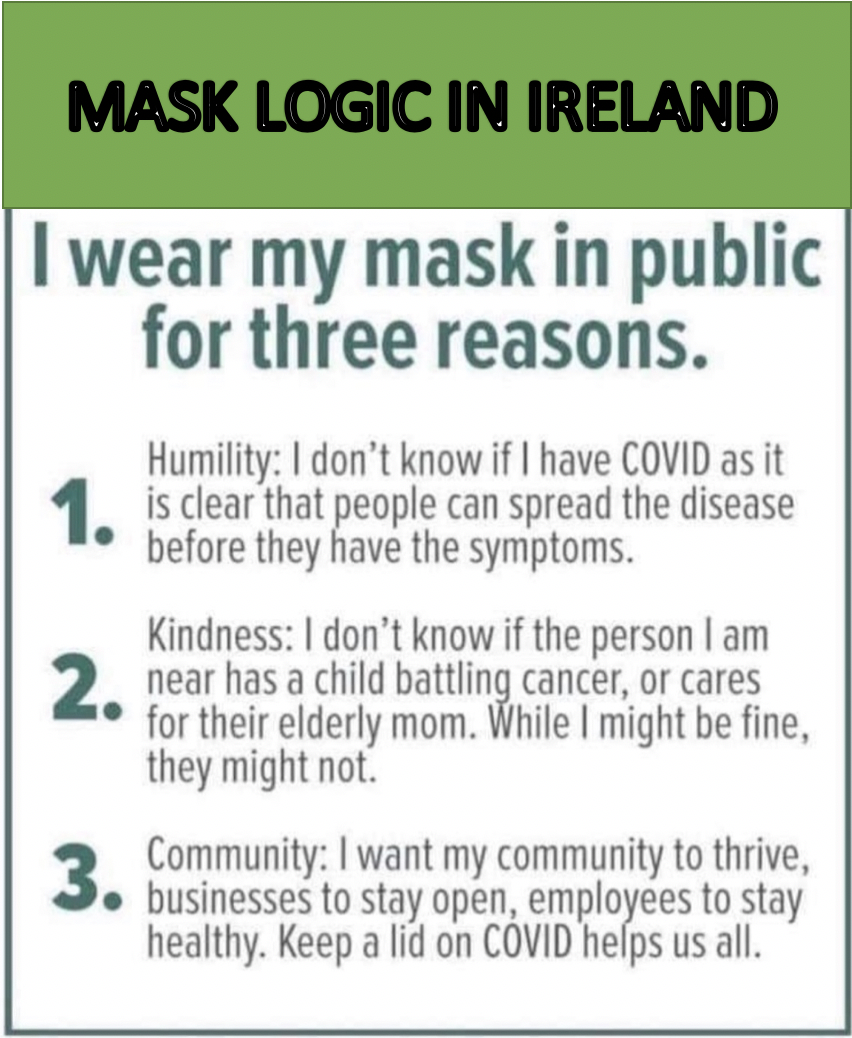
Those restrictions have recently been lifted and the country is in a phased reopening, similar to what is currently in place in states like New Jersey. The measures taken in Ireland were tough but the results have been worth the sacrifice. The attitudes of the Irish people in facing down the pandemic are in sharp contrast to the politicized and polarized reaction here in the U.S. The Irish philosophy towards wearing masks perhaps typifies their more community-minded approach to this pandemic. We could learn a lot from the Irish.

U.S. National Health Emergency
Day 151 – Wednesday, August 12, 2020
UNITED STATES SHARE OF THE GLOBAL TOTALS04.3% …………… U.S. POPULATION26.0% …………… TOTAL COVID-19 CASES22.5% ………….. TOTAL COVID-19 DEATHS 20.5% …………… NEW COVID-19 CASES (24hr) 22.9%. ………….. NEW COVID-19 DEATHS (24hr) 19th ………….. GLOBAL RANK IN TESTS PER MILLION
UNITED STATES DAILY PANDEMIC STATISTICS
54,519 ………… NEW INFECTIONS (24 hr.)
1,504 …………. NEW DEATHS (24 r.)
763,742 …….…… COVID-19 TESTS GIVEN (24 hr.)
202,106* …………. TESTS PER MILLION POPULATION
20% …………. TOTAL TESTS / US POPULATION
* For context, daily testing rates should be between one and three million per day.
COMMENTS: The U.S. had the third-highest number of new infections in the world behind India and Brazil, but had the most COVID-19 deaths in the world yesterday. Testing numbers are still not climbing upward as they should be. California had the highest number of new cases yesterday and Florida had the highest number of deaths. California, Texas, Florida, and Georgia accounted for 54% of all new U.S. infections yesterday.


U.S. National Health Emergency
Day 150 – Tuesday, August 11, 2020
UNITED STATES SHARE OF THE GLOBAL TOTALS04.3% …………… U.S. POPULATION26.0% …………… TOTAL COVID-19 CASES22.5% ………….. TOTAL COVID-19 DEATHS 23.0% …………… NEW COVID-19 CASES (24hr) 12.4%. ………….. NEW COVID-19 DEATHS (24hr) 19th ………….. GLOBAL RANK IN TESTS PER MILLION
UNITED STATES DAILY PANDEMIC STATISTICS
49,800 ………… NEW INFECTIONS (24 hr.)
569 …………. NEW DEATHS (24 r.)
745,364 …….…… COVID-19 TESTS GIVEN (24 hr.)
199,803* …………. TESTS PER MILLION POPULATION
20% …………. TOTAL TESTS / US POPULATION
* For context, daily testing rates should be between one and three million per day.
COMMENTS: The U.S. is second again behind India in the number of new infections. Deaths are still trending downs relative to the rest of the world. Testing in the U.S. has plateaued and may be trending downward (we shall see). We are 150 days into this National Health Emergency and still, only enough COVID-19 tests have been given to date to test just 1 out of 5 Americans if each person was given only one test.
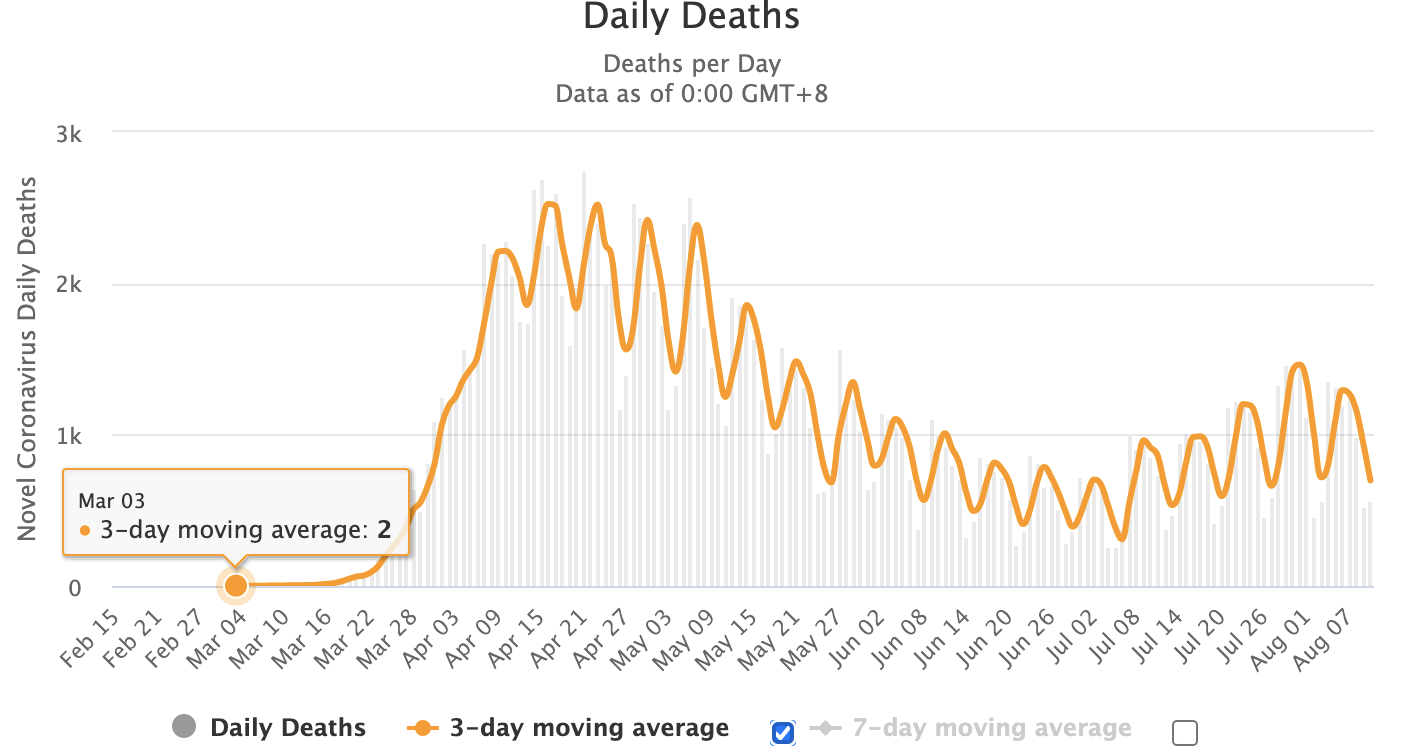
Interestingly, a look back at the peaks and valleys of daily reporting over time, both the daily new cases and COVID deaths, reveals that there is a weekly reporting cycle where the peaks mostly happen mid-week and the valleys occur around the weekends. The line graph of reported deaths for a three-day daily average (below) shows the regularity of this weekly reporting pattern. When looking at these daily statistical totals, the day of the week should be factored in. Note that there are 18 peaks in the graph below which correspond to the 18 weeks between April 3rd, and August 7th.

U.S. National Health Emergency
Day 149 – Monday, August 10, 2020
UNITED STATES SHARE OF THE GLOBAL TOTALS04.3% …………… U.S. POPULATION26.0% …………… TOTAL COVID-19 CASES22.6% ………….. TOTAL COVID-19 DEATHS 21.4% …………… NEW COVID-19 CASES (24hr) 11.1%. ………….. NEW COVID-19 DEATHS (24hr) 19th ………….. GLOBAL RANK IN TESTS PER MILLION
UNITED STATES DAILY PANDEMIC STATISTICS
47,979 ………… NEW INFECTIONS (24 hr.)
534 …………. NEW DEATHS (24 r.)
6543.3 …….…… COVID-19 TESTS GIVEN (24 hr.)
197,553* …………. TESTS PER MILLION POPULATION
19.8% …………. TOTAL TESTS / US POPULATION
* For context, daily testing rates should be between one and three million per day.
COMMENTS: The U.S. is second behind a surging India virus transmission rate. Again, India has a 1.1 billion more people. California had the most new cases yesterday and Texas had the most new deaths. New Jersey still has the most deaths per million population while California, Florida, and Texas now have more total cases than New York.

U.S. National Health Emergency
Day 148 – August 9, 2020
UNITED STATES SHARE OF THE GLOBAL TOTALS04.3% …………… U.S. POPULATION26.0% …………… TOTAL COVID-19 CASES22.7% ………….. TOTAL COVID-19 DEATHS 20.6% …………… NEW COVID-19 CASES (24hr) 17.4%. ………….. NEW COVID-19 DEATHS (24hr) 19th ………….. GLOBAL RANK IN TESTS PER MILLION
UNITED STATES DAILY PANDEMIC STATISTICS
54,199 ………… NEW INFECTIONS (24 hr.)
976 …………. NEW DEATHS (24 r.)
822,628 …….…… COVID-19 TESTS GIVEN (24 hr.)
195,075* …………. TESTS PER MILLION POPULATION
19.5% …………. TOTAL TESTS / US POPULATION
* For context, daily testing rates should be between one and three million per day.
COMMENTS: The U.S. is back to number two in daily new cases behind India, which has over a billion more people. The spread of infections is still concentrated in Florida, California, and, Texas which together account for about 41% of the daily new infections. Lousiana, Arizona, and Florida still have the most cases per one-million population. Our daily testing numbers are starting to plateau.
We are 148 days into our National Health Emergency yet if only one COVID-19 test was given per person in the United State to date, fewer than 1 in 5 people would have been tested. There has never been a universal agreement as to how much testing is needed in the United States in part because estimates are based on differing goals and strategies to control the virus. But there is universal agreement that our current testing numbers are inadequate. Ramping up testing to meet the current national need cannot be accomplished without federal intervention and the invoking of the National Defense Procurement Act by the President. Back in April, when there were about 25,000 new cases a day, the estimated number of COVID-19 tests needed for various strategies to bring the spread of infection under control was published in a table by the Kaiser Family Foundation. The minimum number of daily tests among the models at that time was 3 million tests per day. (see KFF table below)
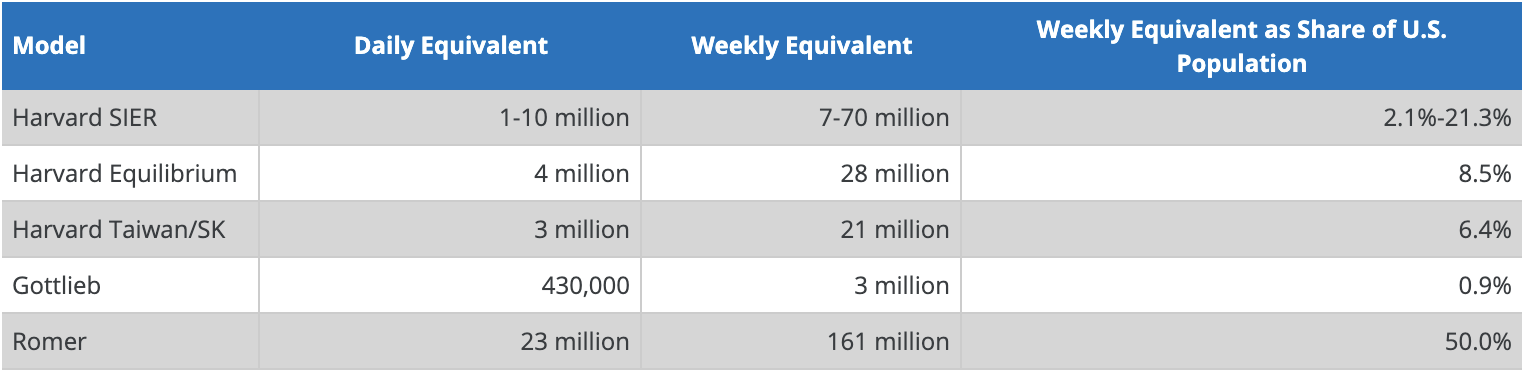


<- Total tests, tests/million, U.S. population
U.S. National Health Emergency
Day 147 – August 8, 2020
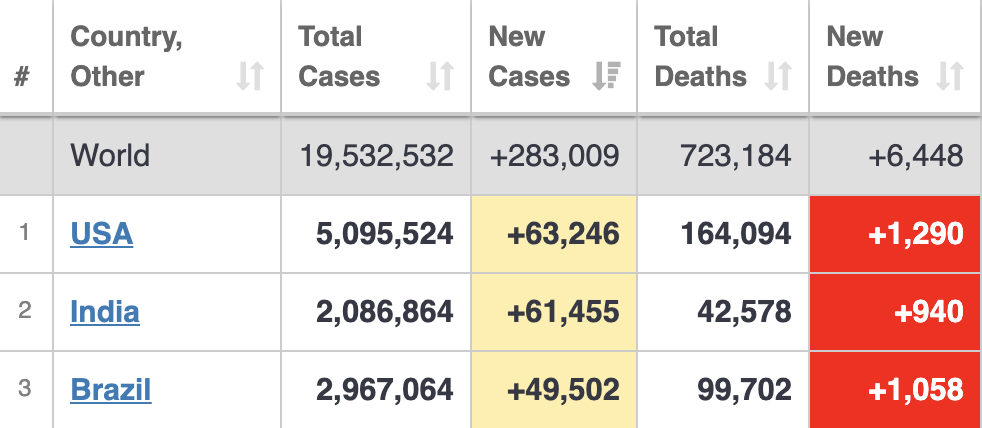
UNITED STATES SHARE OF THE GLOBAL TOTALS04.3% …………… U.S. POPULATION26.1% …………… TOTAL COVID-19 CASES22.7% ………….. TOTAL COVID-19 DEATHS 26.6% …………… NEW COVID-19 CASES (24hr) 20.0%. ………….. NEW COVID-19 DEATHS (24hr) 19th ………….. GLOBAL RANK IN TESTS PER MILLION
UNITED STATES DAILY PANDEMIC STATISTICS
63,246 ………… NEW INFECTIONS (24 hr.)
1,290 …………. NEW DEATHS (24 r.)
758,346 …….…… COVID-19 TESTS GIVEN (24 hr.)
192,992* …………. TESTS PER MILLION POPULATION
19.3% …………. TOTAL TESTS / US POPULATION
* For context, this number should be over one-million.
COMMENTS: The recent slow down in daily virus testing has pushed us back to 19th place in national tests per million. Both the number of new infections and deaths in the past 24 hours has risen, making the US number one in both. (Beginning today the daily tables will appear at the top of this blog instead of having to scroll to the bottom.)

<- Total tests, tests/million, U.S. population
U.S. National Health Emergency
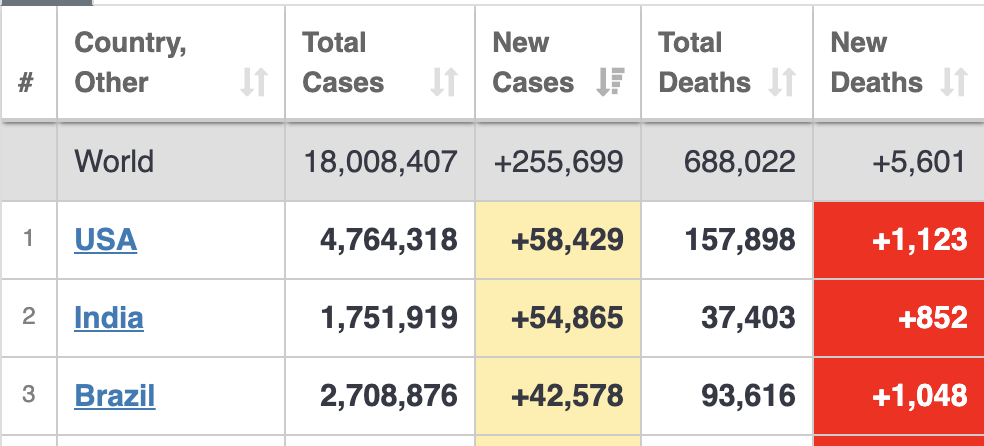
Day 146 – August 7, 2020
UNITED STATES SHARE OF THE GLOBAL TOTALS04.3% …………… U.S. POPULATION26.2% …………… TOTAL COVID-19 CASES22.7% ………….. TOTAL COVID-19 DEATHS 20.9% …………… NEW COVID-19 CASES (24hr)18.6%. ………….. NEW COVID-19 DEATHS (24hr)18th ………….. GLOBAL RANK IN TESTS PER MILLION
UNITED STATES DAILY PANDEMIC STATISTICS
58,611 ………… NEW INFECTIONS (24 hr.)
1,203 …………. NEW DEATHS (24 r.)
756,852 …..…… COVID-19 TESTS GIVEN (24 hr.)
190,640* …………. TESTS PER MILLION POPULATION
19.1% …………. TOTAL TESTS / US POPULATION
* For context, this number should be over one-million.
COMMENTS: [No Comments]


U.S. National Health Emergency
Day 145 – August 6, 2020
UNITED STATES SHARE OF THE GLOBAL TOTALS04.3% …………… U.S. POPULATION26.2% …………… TOTAL COVID-19 CASES22.8% ………….. TOTAL COVID-19 DEATHS 20.3% …………… NEW COVID-19 CASES (24hr)19.2%. ………….. NEW COVID-19 DEATHS (24hr)18th ………….. GLOBAL RANK IN TESTS PER MILLION
UNITED STATES DAILY PANDEMIC STATISTICS
56,148 ………… NEW INFECTIONS (24 hr.)
1,311 …………. NEW DEATHS (24 r.)
762,258 …..…… COVID-19 TESTS GIVEN (24 hr.)
188,353* …………. TESTS PER MILLION POPULATION
18.8% …………. TOTAL TESTS / US POPULATION
* For context, this number should be over one-million.
COMMENTS: The U.S. had the second most new cases yesterday. A word about childhood transmission of the virus, following this comment yesterday from our President:
“… children are almost — and I would almost say definitely — but almost immune from this disease.”
It has long been observed that children are less likely to show symptoms of COVID-19, but it has never been suggested that this means they are immune. Children have been getting sick and dying from the virus all along. A recent study shows that children who do have symptoms are just as likely as adults to spread it to others:
6/30/2020 – Researchers have discovered that children younger than 5 years with mild to moderate COVID-19 have much higher levels of genetic material for the virus in the nose compared to older children and adults. The findings point to the possibility that the youngest children transmit the virus as much as other age groups.
A scientific study to learn about the incidents of COVID-19 infection rates in children was launched in May.
“A study to help determine the rate of novel coronavirus infection in children and their family members in the United States has begun enrolling participants. The study, called Human Epidemiology and Response to SARS-CoV-2 (HEROS), also will help determine what percentage of children infected with SARS-CoV-2, the virus that causes COVID-19, develop symptoms of the disease.”
The study has yet to be completed, so a definitive answer as to the incident rate of the virus in children isn’t known yet, but it certainly isn’t zero, as the President is claiming.

U.S. National Health Emergency
Day 144 – August 5, 2020
UNITED STATES SHARE OF THE GLOBAL TOTALS04.3% …………… U.S. POPULATION26.3% …………… TOTAL COVID-19 CASES22.8% ………….. TOTAL COVID-19 DEATHS 21.3% …………… NEW COVID-19 CASES (24hr)13.0%. ………….. NEW COVID-19 DEATHS (24hr)18th ………….. GLOBAL RANK IN TESTS PER MILLION
UNITED STATES DAILY PANDEMIC STATISTICS
54,540 ………… NEW INFECTIONS (24 hr.)
1,362 …………. NEW DEATHS (24 r.)
681,496 …..…… COVID-19 TESTS GIVEN (24 hr.)
186,055* …………. TESTS PER MILLION POPULATION
18.6% …………. TOTAL TESTS / US POPULATION
* For context, this number should be over one-million.
COMMENTS: We are 144 days into our national health emergency and still have over 20% of the world’s new cases despite being only 4.3% of the global population. Over 1,300 people died of the disease yesterday (R.I.P), a number that is within statistical expectations given the peak number of new cases it reflects. (It is not a statistical correction). Texas, Florida, and California still have the largest outbreaks.


U.S. National Health Emergency
Day 143 – August 4, 2020
UNITED STATES SHARE OF THE GLOBAL TOTALS04.3% …………… U.S. POPULATION26.4% …………… TOTAL COVID-19 CASES22.8% ………….. TOTAL COVID-19 DEATHS 24.3% …………… NEW COVID-19 CASES (24hr)13.0%. ………….. NEW COVID-19 DEATHS (24hr)18th ………….. GLOBAL RANK IN TESTS PER MILLION
UNITED STATES DAILY PANDEMIC STATISTICS
48,646 ………… NEW INFECTIONS (24 hr.)
567 …………. NEW DEATHS (24 r.)
1,002,033 …..…… COVID-19 TESTS GIVEN (24 hr.)
184,000* …………. TESTS PER MILLION POPULATION
18.4% …………. TOTAL TESTS / US POPULATION
* For context, this number should be over one-million.
COMMENTS: It looks like we have turned a corner. Both new cases and new COVID-19 deaths are down… but wait? Aren’t COVID deaths a trailing indicator? Doesn’t it take 10 to 20 days for the number dying of COVID-19 to become reflected? Yesterday the death toll was 2 times less than the day before, now today it is only slightly over yesterday’s number. What happened 10 to 20 days ago? Was there a drop in cases?
No! In fact, the average number of new infections in that 10 day period was at an all-time peak. The 10 day average during the peek was 63,451 new cases per day, while the average number of deaths in the past two days is 517 per day. That means a very low mortality ratio of 0.8%. It was about 2% on the prior days. Either we have achieved a remarkable drop in mortality rates or the numbers are off and we should see a correction over the next few days.
PS: Our global percentage of COVID-19 deaths continues to decline, also, despite our global rise in new cases relative to the world.
U.S. National Health Emergency
Day 142 – August 3, 2020
UNITED STATES SHARE OF THE GLOBAL TOTALS04.3% …………… U.S. POPULATION26.4% …………… TOTAL COVID-19 CASES22.9% ………….. TOTAL COVID-19 DEATHS 22.2% …………… NEW COVID-19 CASES (24hr)10.5%. ………….. NEW COVID-19 DEATHS (24hr)18th ………….. GLOBAL RANK IN TESTS PER MILLION
UNITED STATES DAILY PANDEMIC STATISTICS
52,783 ………… NEW INFECTIONS (24 hr.)
467 …………. NEW DEATHS (24 r.)
708,599 ………… COVID-19 TESTS GIVEN (24 hr.)
178,841* …………. TESTS PER MILLION POPULATION
18.1% …………. TOTAL TESTS / US POPULATION
* For context, this number should be over one-million.
COMMENTS: The U.S. had the second largest number of new infections yesterday, thanks to rising numbers in India (which has a billion more people). COVID-19 deaths recorded yesterday was 2 times less than the past 4-day average. I suspect we will see a correction, yesterday being a Sunday.
U.S. National Health Emergency
Day 141 – August 2, 2020
UNITED STATES SHARE OF THE GLOBAL TOTALS04.3% …………… U.S. POPULATION26.5% …………… TOTAL COVID-19 CASES22.9% ………….. TOTAL COVID-19 DEATHS 25.9% …………… NEW COVID-19 CASES (24hr)20.0%. ………….. NEW COVID-19 DEATHS (24hr)18th ………….. GLOBAL RANK IN TESTS PER MILLION
UNITED STATES DAILY PANDEMIC STATISTICS
58,429 ………… NEW INFECTIONS (24 hr.)
1,123 …………. NEW DEATHS (24 r.)
635,857 ………… COVID-19 TESTS GIVEN (24 hr.)
178,841* …………. TESTS PER MILLION POPULATION
17.9% …………. TOTAL TESTS / US POPULATION
* For context, this number should be over one-million.
COMMENTS: [no comments]

U.S. National Health Emergency
Day 140 – August 1, 2020
UNITED STATES SHARE OF THE GLOBAL TOTALS04.3% …………… U.S. POPULATION26.6% …………… TOTAL COVID-19 CASES23.0% ………….. TOTAL COVID-19 DEATHS 24.5% …………… NEW COVID-19 CASES (24hr)22.7%. ………….. NEW COVID-19 DEATHS (24hr)19th ………….. GLOBAL RANK IN TESTS PER MILLION
UNITED STATES DAILY PANDEMIC STATISTICS
70,904 ………… NEW INFECTIONS (24 hr.)
1,462 …………. NEW DEATHS (24 r.)
1,069,908 ………… COVID-19 TESTS GIVEN (24 hr.)
176,923 * …………. TESTS PER MILLION POPULATION
17.7% …………. TOTAL TESTS / US POPULATION
* For context, this number should be over one-million.
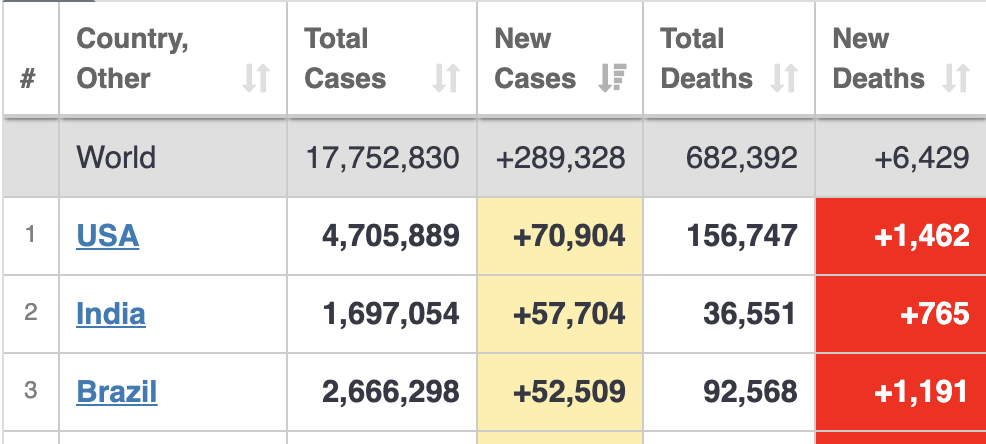
COMMENTS: It’s 140 days since Donald Trump declared a National Health Emergency. We have less than 5% of the world’s population and yesterday we had nearly 25% of all new infections in the world. We are among the 10 worst countries in terms of both COVID cases and deaths since the pandemic began. We are 19th in tests given per million despite our need for testing being more critical than in most other countries right now. Despite this, testing isn’t “ramping up” but barely crawling scaling up at all. I updated the seven-day average of daily testing in the U.S. (below) and added a graphic from a NY Times article today debunking the President’s claim that our high case numbers are due to our high testing numbers. This isn’t true. And testing doesn’t “cause” infections!
Back to Black – Racism and Police Homicides in America
by Brian T. Lynch, MSW
 |
| Mr. George Floyd of Minnesota |
Once again, an egregious police homicide of a Black man caught on videotape shatters the calm and erupts into national protests and outrage. This time it is George Floyd of Minnesota. His life was slowly squeezed out of him as he lay bound and helpless while a seemingly depraved and indifferent cop pinned Mr. Floyd’s neck to the pavement with his knee.
Once again, the eyes of the nation turn towards the seemingly intractable problem of racism that, among its many forms, would cause African Americans to be nearly twice as likely to die at the hands of law enforcement than White Americans. Racism is our greatest barrier to becoming a more perfect union and at present, the racists seem to have ascended to power.
And once again, this despicable racial killing by a cop in broad daylight has ignited a blaze that masks an underlying outrage behind the numbers. About one-thousand American civilians are being killed every year by our civilian police force. From January 1, 2015, through December 31, 2019, there have been 1,179 police homicides of Black citizens, 2,242 homicides of White citizens, 843 police homicides of Hispanic civilians, and a total of at least 4,947 civilians killed by police.
 |
| Data is from the Washington Post database. Analysis by the author. |
Civilian homicides by police always rise to public attention because they so disproportionally target African-Americans. Once the problem is framed as a systemic racial issue the proposed remedies never reach beyond the disproportionality question. The fact that our highly aggressive and militant police training is resulting in thousands of needless deaths never comes to light. Until that is addressed, the proposed solutions will never be to anyone’s satisfaction.
 |
| Data from the Washington Post database. Analysis by the Author |
Civilian homicide rates by law enforcement in America are orders of magnitude higher than in Great Britain, France, or Germany. Yet, the actual number of civilian deaths could be considerably larger still. There is no mandatory federal tracking of homicides caused by police in the line of duty. Federal reporting is all voluntary and spotty at best. The countries best numbers come by combing through local newspaper accounts and gleaning what can be learned from the public account of police-involved civilian deaths. This civilian effort to track police homicides only started about five years ago. It is an imperfect system. Clearly, not all police shootings make it into the local newspapers. The information reported is rarely investigated by local reporters. They are the accounts given to the press by the local police officials. And there are undoubtedly police-related fatalities of civilians that are never reported in the local press.
No racial activist would be or should be satisfied if successful remedies to the racial problem merely end racial disparities. In practical terms that would mean about 103 fewer Black minority deaths each year while still tolerating 133 annual minority homicides. It would be equally crazy to accept 448 White civilian death by the police as long as this carnage is in proportional to the number of Blacks and Hispanics that are also killed each year.
 |
| Data is from the Washington Post database. The analysis is by the author. |
The militarization of the American police force is its own grave problem that must be addressed. If German laws and police practices were adopted here, adjusted for our larger population, the United States might expect only about 40 police homicides per year, mostly justified uses of force, as opposed to nearly 1,000.
The arguments for this position on police homicides are in numbers found in the tables I created from the data contained in five year’s worth of information collected by the Washington Post. Seeing all the names as you scroll down that database of the dead is sobering.
——————————————–
Memorial Day Lessons in this 2020 Pandemic
by Brian T. Lynch, MSW
Before we flood back out into the world over Memorial Day of 2020 to remember our fallen soldiers, let’s remember the fallen in this viral war we are fighting today. If you plan to head out to the beaches, locker rooms, barbeques, churches, or synagogues, first remember to honor the lessons taught to us by 100,000 Americans who have already died. They are telling us that we cannot wash away this modern plague. We can not pray it away or wish it away. Until we control the virus through testing, isolating, and contact tracing, or through vaccinations, we are on our own. We must protect ourselves and everyone around us from the air we all breathe.
First, we need to understand that a virus is not a bacteria. Bacteria are small cellular critters that live on surfaces and feed off of the residues of film and grime that cover every surface. Bacteria are alive in most meanings of that word, and if you pick up enough of them on your hands, and touch your eyes, nose, or mouth, you can infect yourself with them.
Viruses like COVID-19 are 100 times smaller. They are mere strands of genetic material with no living activity when not in contact with host cells. They flit about in the air for a time, some of them floating around in moisture droplets released into the air that soon falls to the ground. Other virus strands end up in much smaller aerosol particles that stay suspended in the air for hours until they are sucked into your body when you take in a breath (think MASKS). If you touch a surface recently sprinkled with moisture droplets containing the virus, and then touch your eyes, nose, or mouth without first washing or sanitizing your hands, you may also infect yourself. This is a less common way to catch the virus because these viruses don’t stay intact long when the moisture dries up.
When COVID-19 viruses get sucked into your lungs from the air, they land on the surface of your lung cells (or other cells). They trick the cell walls into letting them come inside. This is when they become active. They take control of the cell and force the cells into replicating them wildly until the cell ruptures, releasing an army of clones into the surrounding tissue. Some of these clones attach to surrounding cells and slip inside to begin replicating again. Others are caught up in the air currents and get rushed outside the body in a breath, or a cough, or a sneeze (think MASKS).
The amount of virus in the air (called virus load) depends on several factors, including how sick a person is who is breathing out the virus, how close to a sick person’s breath-cloud you are (think SOCIAL DISTANCING), the volume of air per person in a given enclosed space, the air exchange rate in a building or enclosure and the length of time that a sick person is breathing virus into the air in a room, for example (think MASKS).
The manner of a sick person’s breath matters also. A cough releases a lot more virus than a breath and a sneeze releases a huge amount of airborne virus that travels at up to 200 miles per hour across a room (think MASKS). But as we learned the hard way, even one pre-symptom person singing in a choir can release copious amounts of virus in the air and infect nearly everyone else at a rehearsal.
Finally, our exposure to COVID-19 virus in the air is dependent on two factors, the virus load in the air we are breathing (again, think MASKS) and the length of time that we are breathing contaminated air. It’s a little like radiation exposure in this sense. No amount of exposure is entirely safe, but the amount of radiation and the length of time we are exposed increases our odds of getting sick.
So, as you venture out and about in the coming days, don’t poke your face into anyone’s breath cloud. Keep your social distance. Wear a mask when you are in close contact with others. Always wear a mask in stores, gyms, churches, homes, or any other enclosure where you are not alone. You don’t need a mask in the open air where no one is by you, but keep it handy. Your life could depend on it.
